Statistics provide students and research scholars with the ability to evaluate numerical data to discover patterns that lead to important findings. The z-score serves as a primary assessment tool that researchers and students utilize to measure how far a particular value deviates from the dataset's mean. Through z-score analysis, students can compare different data sets to assess whether particular values exist at common or uncommon levels. The z-score in statistics formula enables students to convert data into standardized scores, which simplifies their assessment process. The z-score function provides a method to describe how values distribute throughout the data set.
Understanding the Concept of Z-Score in Statistics and Why It Is Important in Data Analysis
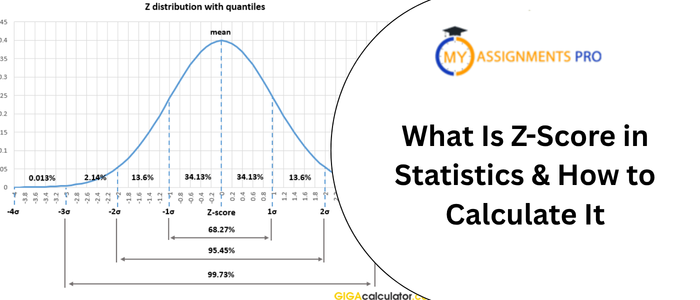
The z-score in statistics measures how much a data point moves away from the mean of its data set. The z-score shows how far a value lies from the mean in terms of standard deviations. This concept enables users to compare any value with any value from any data set, which makes it extremely helpful.
In statistics, a value that is higher than the average is indicated by a positive z-score. The value is below the average when the z-score is negative. When the z-score is zero, the value is equal to the average.
The z-score in statistics enables researchers to assess any data point against all existing data points. Students use the z-score to determine how typical or uncommon their value is among the data set.
Standardized scoring makes data analysis procedures more efficient. The z-score formula transforms a value into its corresponding z-score, which helps statisticians analyze data patterns and differences.
The Mathematical Z-Score Formula and Step-by-Step Method Explaining How to Calculate Z-Score
Analyzing how individual data values relate to a dataset's average requires an understanding of the mathematical foundation of the z-score in statistics. By quantifying a value's difference from the mean in terms of standard deviations, the z-score standardizes data. This facilitates the identification of trends in data analysis and the comparison of values from various datasets. Students can convert unprocessed data into a standardized measure that facilitates more in-depth statistical analysis by learning the z-score formula and the proper way to calculate it.
The z-score in statistics serves as a common statistical tool that researchers across disciplines, including data science, psychology, and economics, use for their work. The z-score formula enables students to perform accurate calculations and interpret z-scores correctly when they analyze statistical data.
Z = σ/ x−μ
In this formula:
- z represents thez-score in statistics
- x represents the individual data value in the dataset
- μ (mu) represents the mean or average of the dataset
- σ (sigma) represents the standard deviation of the dataset
The z-score formula requires you to subtract the mean from the observed value and then divide the result by the standard deviation. The computation shows how many standard deviations the value moves away from the mean.
Step 1: Determine the Mean of the Dataset
The first step to calculating the z-score in statistics is to determine the average of the entire dataset. Mean stands for the center value that pretty much depicts how the data is spread across the whole set. It becomes pretty straightforward to figure out the amount by which one data value differs from the mean once the mean value has been obtained.
Step 2: Calculate the Standard Deviation
The second step requires calculating the standard deviation, which measures how much the data points in the dataset spread out from their central value. The standard deviation provides a measurement of data variability because a higher value shows greater spread, while a lower value shows data points that remain close to the average. The standard deviation functions as an essential component of the z-score formula because it creates a standardized measure that calculates the distance between a data point and the mean.
Step 3: Subtract the Mean from the Data Value
The z-score in statistics calculation requires the mean to be removed from the specific data point, which needs assessment after the mean and standard deviation values have been established. The calculation shows how much the value differs from the mean of the dataset.
Step 4: Divide by the Standard Deviation
The previous step found a difference which gets divided by the standard deviation calculated in the final step. The phase begins with the transformation of the raw difference into a standardized value, which shows the statistical z-score through the application of the z-score algorithm. The resulting figure displays how many standard deviations the data point moves away from the average value.
Z-Score Interpretation and What Different Z-Score Values Indicate in Statistical Studies
The next crucial stage in statistical analysis is to learn z-score interpretation after mastering the z-score formula and how to compute the z-score. The z-score provides researchers and students with a better understanding of the data value's position relative to the entire dataset. The z-score in statistics defines the number of standard deviations that a specific result deviates from the mean. Analysts use this information to determine whether a data point belongs to the normal range of values or whether it exists as an extreme high or extreme low value.
Z-score interpretation serves as an essential requirement for multiple academic and professional fields that range from economics to psychology and education, through to data science. The analysis of z-score in statistics allows researchers to identify outliers that require additional investigation while also comparing outcomes across different datasets. The standardized scores in numerous z-score data analysis examples allow researchers to interpret complex information more easily.
Interpreting a Z-Score of Zero
In statistics, a z-score of zero indicates that the data value is precisely equal to the dataset mean. Stated otherwise, the observation is located in the middle of the distribution. This kind of outcome shows that the value is representative of a typical or average observation.
A value with a z-score of zero is frequently used in data analysis examples as the baseline point for comparison with other values. Students who comprehend this idea are better able to evaluate the z-score in statistics accurately while analyzing statistical data.
Interpreting Positive Z-Score Values
A positive z-score shows that a data value exceeds the average value of the dataset in statistics. The observation deviates further from the average in an upward direction, the greater the positive value. The z-score of +1 indicates that the result stands one standard deviation above the mean.
Students can more easily recognize these disparities when they learn how to compute the z-score. Positive z-scores are frequently used in data analysis to detect exceptionally strong financial returns, above-average test scores, or high-performing children.
By understanding this kind of z-score interpretation, researchers are able to identify observations that are considered above average when compared against their corresponding dataset averages.
Interpreting Negative Z-Score Values
A z-score of less than zero indicates that the data point sits below the average. For example, a z-score of -1 indicates that the observation is one standard deviation below the mean. As the value moves further away from zero into the negative, the observation becomes less than the other observations in the dataset.
When analyzing performance data or finding low values within a distribution, this part of the z-score in statistics interpretation is helpful. Negative z-scores in data analysis frequently draw attention to observations that are below expectations.
Identifying Extreme Values and Outliers
Finding extreme values or outliers in a dataset is one of the most crucial applications of z-score interpretation. Values over ±3 are frequently categorized as strong outliers, while values with z-scores larger than +2 or less than 2 are typically regarded as uncommon.
Analysts can quickly identify anomalous patterns in data by using the z-score formula and knowing how to compute the z-score. Numerous instances of z-score data analysis demonstrate how this technique is applied in scientific experiments, financial modeling, and research projects to identify anomalous observations.
The interpretation of the z-score is important for students and researchers who want to obtain useful conclusions from the data that has been collected from other studies, through the use of statistical data. The z-score allows for values to be standardized by their respective sample groups, allowing researchers to make comparisons between different research projects and datasets.
Practical Examples of Z-Score in Data Analysis Across Different Academic and Research Fields
Students who study z-score applications in real-world situations find it easier to grasp statistical concepts. The actual value of this statistical concept exists because it can be used in multiple fields of study and professional work, yet people must first learn how to calculate z-score before they can understand its true worth. Data analysts use z-score instances to establish standardized data, perform observation comparisons, and identify unusual patterns within their datasets.
Here are a few real-world examples of how z-score interpretation is applied in many fields to efficiently analyze and assess data.
Education and Academic Performance Analysis
The z-score in statistics is frequently used in the field of education to compare test scores. Teachers use the z-score algorithm to standardize findings and assess a student's performance in relation to others when various classes or schools have varied average scores.
The z-score calculation enables analysts to determine the distance between a student's score and the mean score, which has an average of 70, and a student's score of 85. The z-score enables teachers to discover which students perform at a high level and which students require additional academic assistance. Educational institutions can fairly assess performance across various groups with the use of accurate z-score interpretation.
Psychology and Behavioural Research
Large volumes of data are frequently gathered by psychologists through surveys, cognitive tests, and behavioral studies. Z-score in statistics aids psychologists in determining if a person's outcome substantially deviates from the typical behavior seen in a study.
Psychologists use the z-score method to create standardized measurement scales, which enable them to compare results from different studies. Extreme z-score values may suggest unusual patterns of behavior or significant research findings, according to multiple cases of z-scores used in psychological research. Researchers can discover experimental data patterns through effective z-score interpretation, which helps them understand human behavior better.
Finance and Risk Assessment
The z-score is a statistical tool that financial analysts commonly use to assess financial risk and investment success. For instance, investors can compare a stock's return to the average market return using the z-score method.
Analysts can determine whether an investment performs above or below market expectations after understanding how to calculate the z-score in statistics. Financial institutions also utilize z-scores to identify possible hazards or anomalous financial patterns in a number of data analysis examples. When analyzing financial data, investors can make well-informed judgments by correctly interpreting z-scores.
Medical and Health Research
A Z-score is a statistical tool used by medical researchers to analyze clinical data and compare patient measurements to accepted medical norms. To assess children's height, weight, or growth patterns in relation to population averages, for instance, pediatricians frequently compute z-scores.
Healthcare practitioners can ascertain whether a patient's measurement is within the normal range by using the z-score formula and knowing how to compute a z-score. Numerous instances of z-score data analysis in medical research assist in identifying developmental issues, dietary shortages, or health anomalies. Correct analysis of medical data and its application to clinical decision-making are ensured by accurate z-score interpretation.
Quality Control and Industrial Research
The z-score in statistics aids businesses in maintaining product quality and identifying flaws during production in manufacturing and industrial research. Engineers can analyze product measurements and ascertain whether they fall within acceptable bounds by using the z-score algorithm.
Quality control teams can easily discover values that considerably depart from the typical production range if they understand how to calculate z-score. These z-score data analysis examples show how statistical methods are applied to manufacturing processes to ensure consistency and dependability. Production systems run smoothly and uphold quality standards when z-scores are interpreted effectively.
Studying practical examples of z-score in data analysis helps students understand the real-world relevance of statistical concepts. The z-score in statistics is not only a theoretical formula but also a powerful tool used in education, psychology, finance, healthcare, and engineering research.
How My Assignments Pro Helps Students Understand Z-Score in Statistics and Complete Academic Assignments?
Students encounter difficulties with statistics because they need to perform calculations and understand complex concepts, such as the z-score in statistics, which requires proper data analysis methods. Many students have trouble using the z-score formula because they do not understand how to compute z-scores or interpret them correctly in academic projects. This is where My Assignments Pro offers trustworthy academic advice and professional assistance.
The software enhances students' comprehension of statistical concepts and helps them analyze z-score examples in data analysis more successfully. Students can improve their understanding and finish excellent statistics tasks with professional help.
Expert Guidance on Understanding Z-Score Concepts
Understanding the theoretical underpinnings of the z-score in statistics is one of the biggest obstacles that students encounter. Interpreting the relationship between data values and a dataset's mean and standard deviation can be challenging for many students.
With step-by-step instructions, My Assignments Pro provides professional counsel that explains the z-score formula and aids students in comprehending how to compute the z-score. In order to help students understand how standard scores function in actual datasets, tutors simplify statistical ideas.
Students become more comfortable using statistical techniques in their academic work by reading thorough explanations and real-world examples of the z-score in data analysis.
Step-by-Step Assistance with Statistical Calculations
Students must accurately calculate and evaluate numerical values in many statistics assignments. However, while using the z-score in statistics algorithm or doing computations, pupils frequently make mistakes.
My Assignments Pro offers students comprehensive academic guidance that demonstrates how to accurately compute the z-score. From determining the mean and standard deviation to correctly interpreting z-scores, experts walk students through every step of the process.
Students can develop their analytical abilities and acquire the correct approach to addressing statistical questions pertaining to the z-score in statistics with this organized assistance.
Support with Data Analysis and Research Assignments
Numerous academic disciplines, including business, economics, psychology, and scientific research, depend heavily on statistical analysis. Analyzing datasets and elucidating the importance of statistical findings are common tasks for students.
My Assignments Pro aids students in comprehending the use of the z-score in statistics for data analysis and research projects. In order to help students comprehend how statistical techniques are used to analyze research findings, experts offer helpful advice using actual examples of z-score in data analysis.
With the help of this academic assistance, students may accurately use the z-score formula and hone their z-score interpretation abilities while working on research projects.
Assistance with Structured and Well-Written Assignments
Students must not only comprehend statistical principles but also present their work in an academic way that is both clear and structured. Many students find it difficult to successfully write analytical reports and explain statistical techniques.
Statistics assignment help assists students in properly structuring their projects while providing clear, expert explanations of statistical terms like z-score. Experts make sure that correct and scholarly explanations of the z-score formula, z-score calculation, and z-score interpretation are provided.
Students can show a greater comprehension of statistical principles in their coursework by using actual instances of z-scores in data analysis.
Reliable Academic Support for Better Learning Outcomes
Both conceptual knowledge and precise data interpretation are necessary for statistics assignments. Students may struggle to correctly apply statistical approaches in the absence of adequate guidance.
Our data analysis assignment help offers dependable academic support that enables students to grasp the z-score formula, learn how to compute z-score efficiently, and master z-score in statistics. Students improve their analytical and research abilities by practicing with actual z-score data analysis examples.

Mitchell Renshaw
Mitchell is a seasoned Ph.D. scholar with extensive expertise gained through years of rigorous research, publication, and teaching experience. He brings a wealth of knowledge and analytical skills to tackle complex academic challenges. His work is dedicated to delivering innovative solutions, advancing knowledge, and promoting academic excellence. Proficient in research methodology, data analysis, and scholarly writing, Mitchell has contributed to peer-reviewed journals and mentored students to achieve academic success.